
NCAAB: William & Mary at James Madison
Team Performance and Analysis for Moneylines
Game Time:2:30 PM
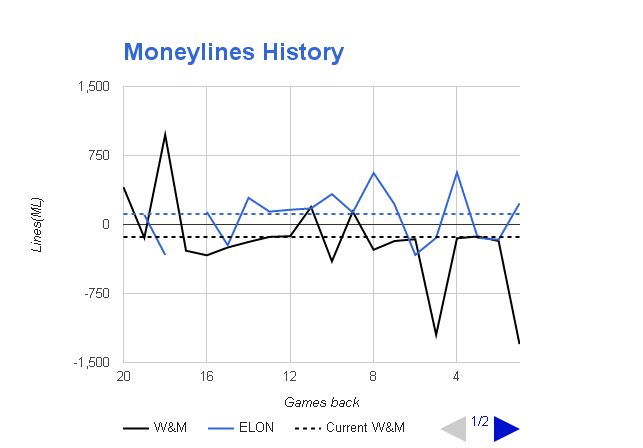
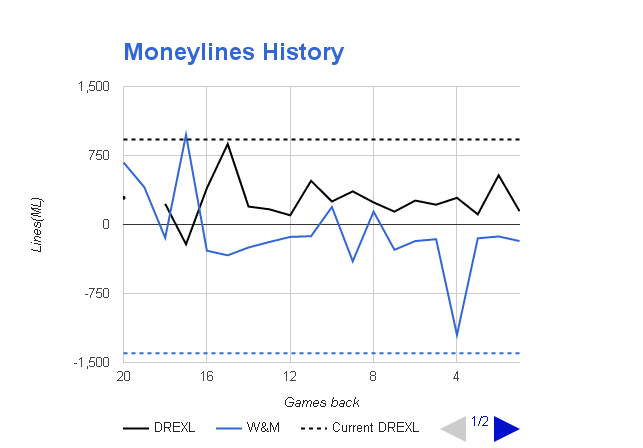
The chart below shows the historical team performance for James Madison and William & Mary .
It shows last 20 games of history of combined performance. We can then use the trends to analyze strength and weakness in the Moneylines.

We search for winning(up) trends, losing (down) trends and extreme patterns that provide a sports betting opportunities.
We can see from the chart above that JMU is outperforming W&M.
Check out how the Odds compare here: NCAAB Moneyline Odds .
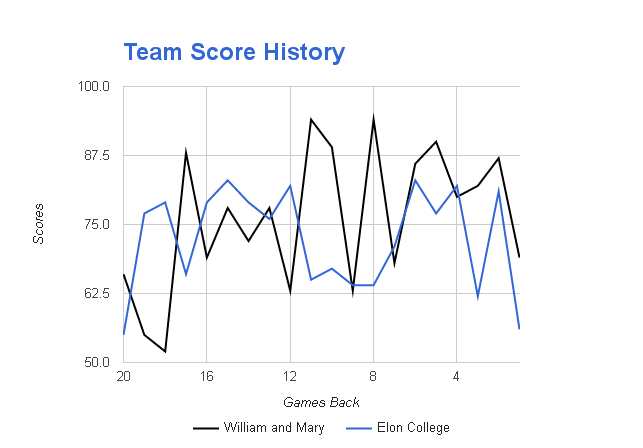
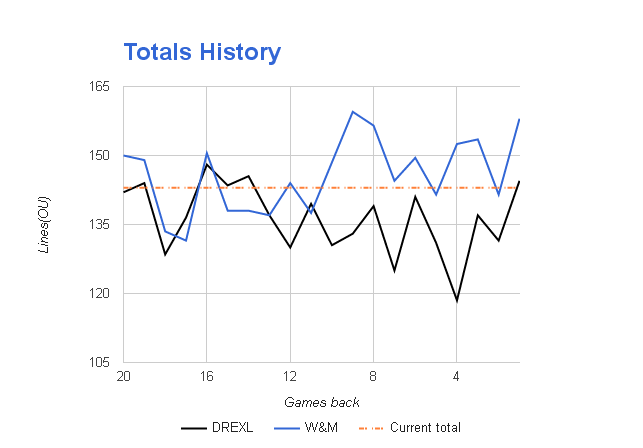
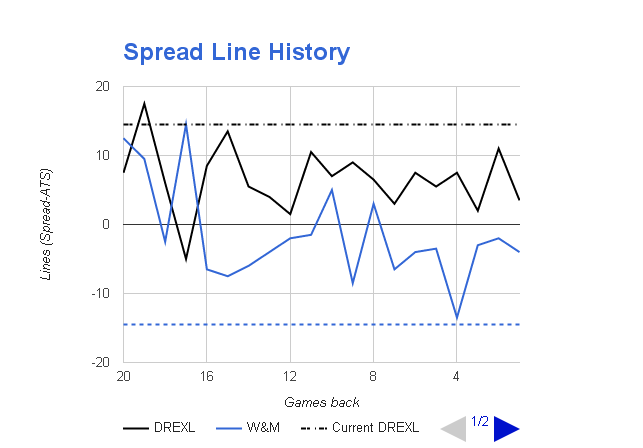
The below chart is the historical lines for each team:
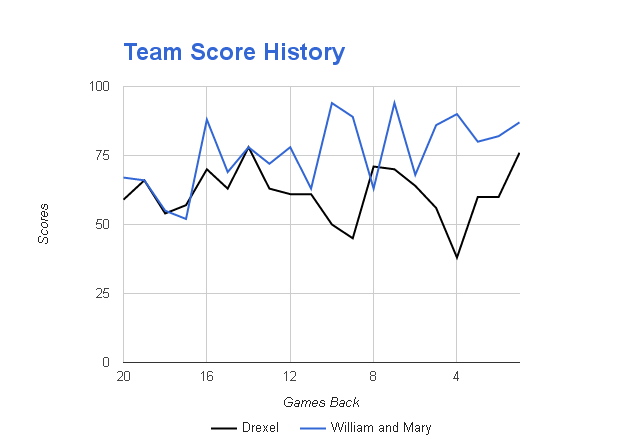
The below chart is the historical scores for each team: