
NCAAF: Alabama at Tennessee
Combined Team Performance Analysis for Totals
Game Time:3:30 PM
The trends below show the historical team performance for Tennessee and Alabama against their respective over under lines.
By analyzing how the teams perform against their over under lines we can see how can gauge the public perception vs actual results .
The most recent results vs OU Lines:
Tennessee=OVER 1 Game(s)
Alabama=OVER 1 Game(s)
We search for winning(up) trends, losing (down) trends that provide a sports betting opportunities. Over trends will usually increase the OU Line for future games. Under Trends will usually reduce the OU Line for Future games.
The combined performance of the two teams over the last 20 games has been Over their respective Totals. The 3 game combined trend of team scoring performance vs their lines has been Over.
Check out how the Totals compare here: CFB Totals .
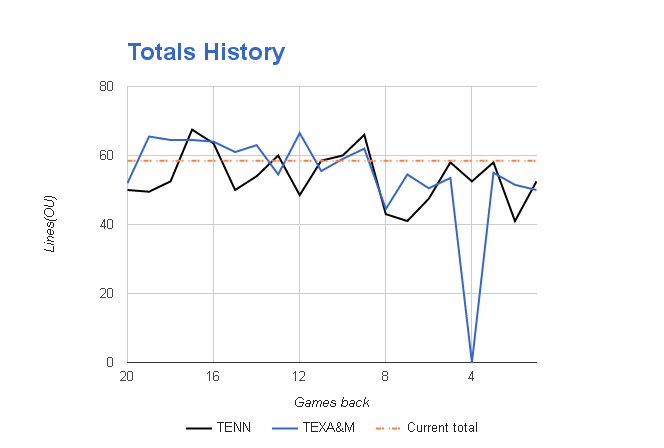
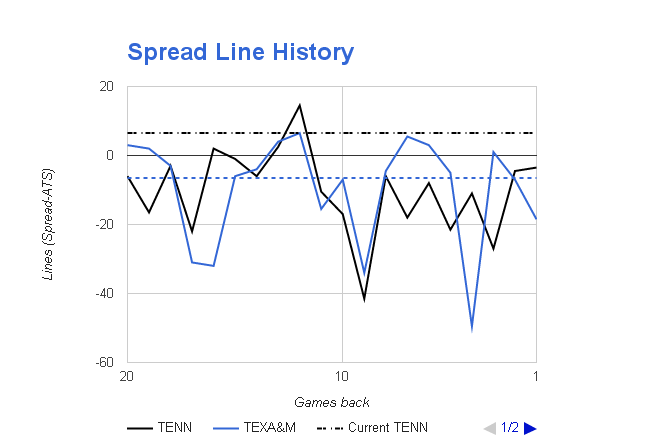
The below chart is the historical lines for each team:
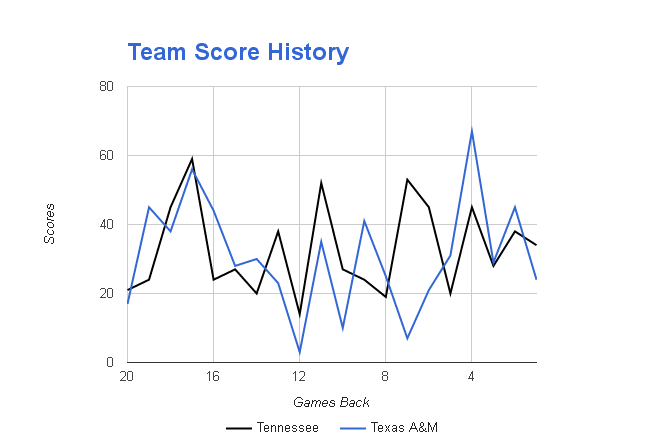
The below chart is the historical scores for each team:
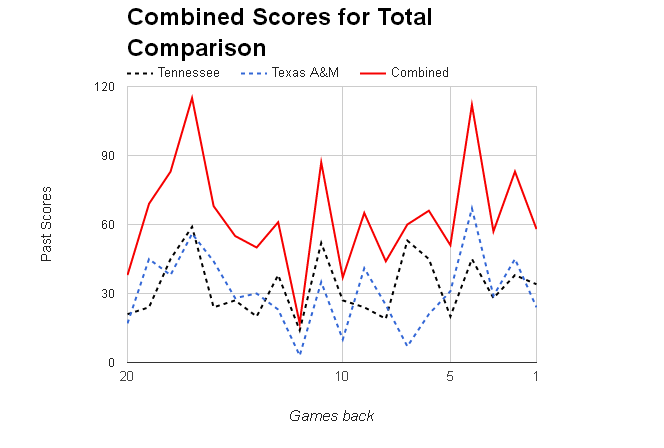
Here are the scores combined:

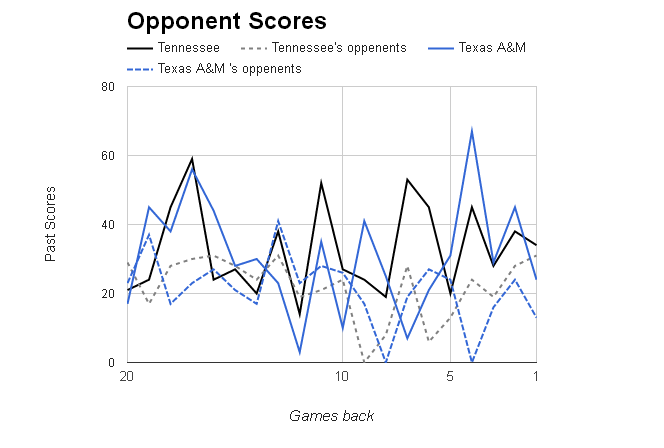
Here is a chart of each team’s opponents: