
NHL: Arizona Coyotes at Anaheim Ducks
Team Performance Analysis for Moneylines
The chart below shows the historical performance for Anaheim Ducks and Arizona Coyotes. This chart can be used to analyze Moneylines.
It shows last 20 games of history and how each team performed. We can then use the trends to analyze strength and weakness in the moneylines.

We search for winning(up) trends, losing (down) trends and extreme patterns that provide sports betting opportunities.
We can see from the chart above that the performance of the two teams shows over the last 20 games ANA has been outperforming ARI.
Check out how the Odds compare here: NHL Moneyline Odds .
The below chart is the historical lines for each team:
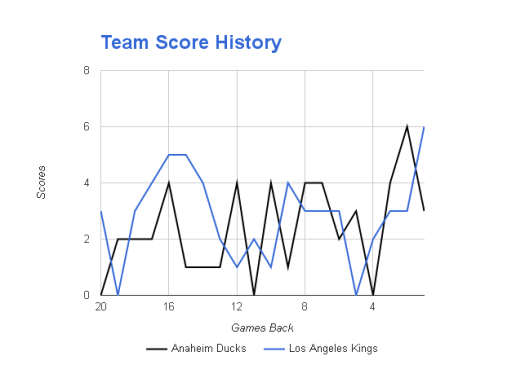
The below chart is the historical scores for each team: